Gold is the most malleable metal. It is dense, soft and ductile and its properties remain without tarnishing when exposed to air or water.
Applications
Due to its unique properties and luster, gold has found applications in fabrication, jewelry, coinage and dentistry.
increased by 13% in 2017, primarily due to a recovery from India.
use of gold increased 5% in 2017, a three year high due to a rise in gold used in bonding wire production.
decreased by 10%, marking the lowest level of fabrication in ten years.
demand for gold was 3% lower in 2017, the lowest in over a decade. Japan remains the largest market in the dentistry industry, accounting for 50% of global demand.
demand increased 3% in 2017, driven higher predominately by a rise in offtake from Europe and Asian markets.
Supply & Demand
| Supply (Tonnes) | 2013 | 2014 | 2015 | 2016 | 2017 |
| Mine Production | 3,076 | 3,180 | 3,222 | 3,251 | 3,247 |
| Scrap | 1,303 | 1,159 | 1,180 | 1,306 | 1,210 |
| Net Hedging Supply | -39 | 108 | 21 | 32 | -41 |
| Total Supply | 4,340 | 4,446 | 4,422 | 4,590 | 4,415 |
| Demand (Tonnes) | |||||
| Jewelry | 2,726 | 2,559 | 2,464 | 1,953 | 2,214 |
| (+) Industrial Fabrication | 428 | 411 | 376 | 366 | 380 |
| Net Official Sector | 409 | 466 | 443 | 269 | 366 |
| (+) Retail Investment | 1,871 | 1,162 | 1,160 | 1,043 | 1,028 |
| Physical Demand | 5,434 | 4,598 | 4,442 | 3,630 | 3,988 |
| Physical Surplus/Deficit | -1094 | -151 | -20 | 959 | 427 |
| ETF Inventory Build | -879 | -155 | -117 | 539 | 177 |
| Exchange Inventory Build | -98 | 1 | -48 | 86 | 0 |
| Net balance | -117 | 3 | 146 | 334 | 250 |
2017 Gold Demand (Tonnes)
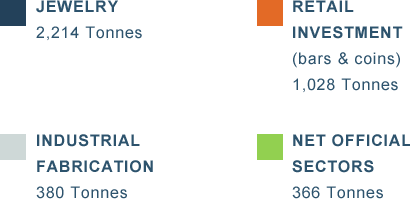
Total physical demand increased by 10% in 2017, largely due to a return to growth in jewelry fabrication and official sector demand.
Total Physical Demand
Supported by
Mine Production
Gold Supply (Tonnes)


Mine Production by Region (Tonnes)
Global mine production in 2017 was relatively unchanged last year. Russia and Suriname saw the largest production increases led by ramp-ups at the countries’ largest operations, while higher grades and fresh ounces were behind strong gains in Canada.
Gold Production by Country (Tonnes)
2016
2017
Investment
Total identifiable investment, which includes physical bar investment, coins and changes to ETF holdings, posted a 24% annual decrease to reach 1,205 tonnes, as higher ETF flows were offset by weaker coin and bar offtake.

Global official coin demand – Coin demand declined by 10% year-on-year in 2017, marking the lowest level of fabrication since 2007.

Physical bar investment - Demand for bullion bars decreased by less than 1% year-on-year to 780 tonnes in 2017.

Exchange Traded Funds - ETF holdings increased by 8% in 2017 to 2,262 tonnes at the end of the year. This performance was the result of strengthened gold prices due to geopolitical tensions over North Korea and the accelerated depreciation of the dollar index.
Source: GFMS Gold Survey 2018